
Chart literacy
Build a clearer understanding of candles, price behavior, market structure, trends, and important levels.
Interactive chart-reading practice
UTA Chartology introduces interactive chart-reading practice through candles, market structure, trends, levels, pullbacks, reversals, and replay-based learning.
Observe · Interpret · Practice
UTA Chartology brings chart-reading practice into the learning experience. Students develop the habit of observing what a chart shows, interpreting its structure, and explaining their reasoning before drawing conclusions.
Built around guided practice in candles, market structure, support and resistance, trends, pullbacks, reversals, replay, and interactive challenges.
The Chartology method
Read candles, price movement, and context carefully.
Study structure, trends, levels, pullbacks, and possible reversals.
Use replay and interactive challenges to explain the chart, not guess at it.
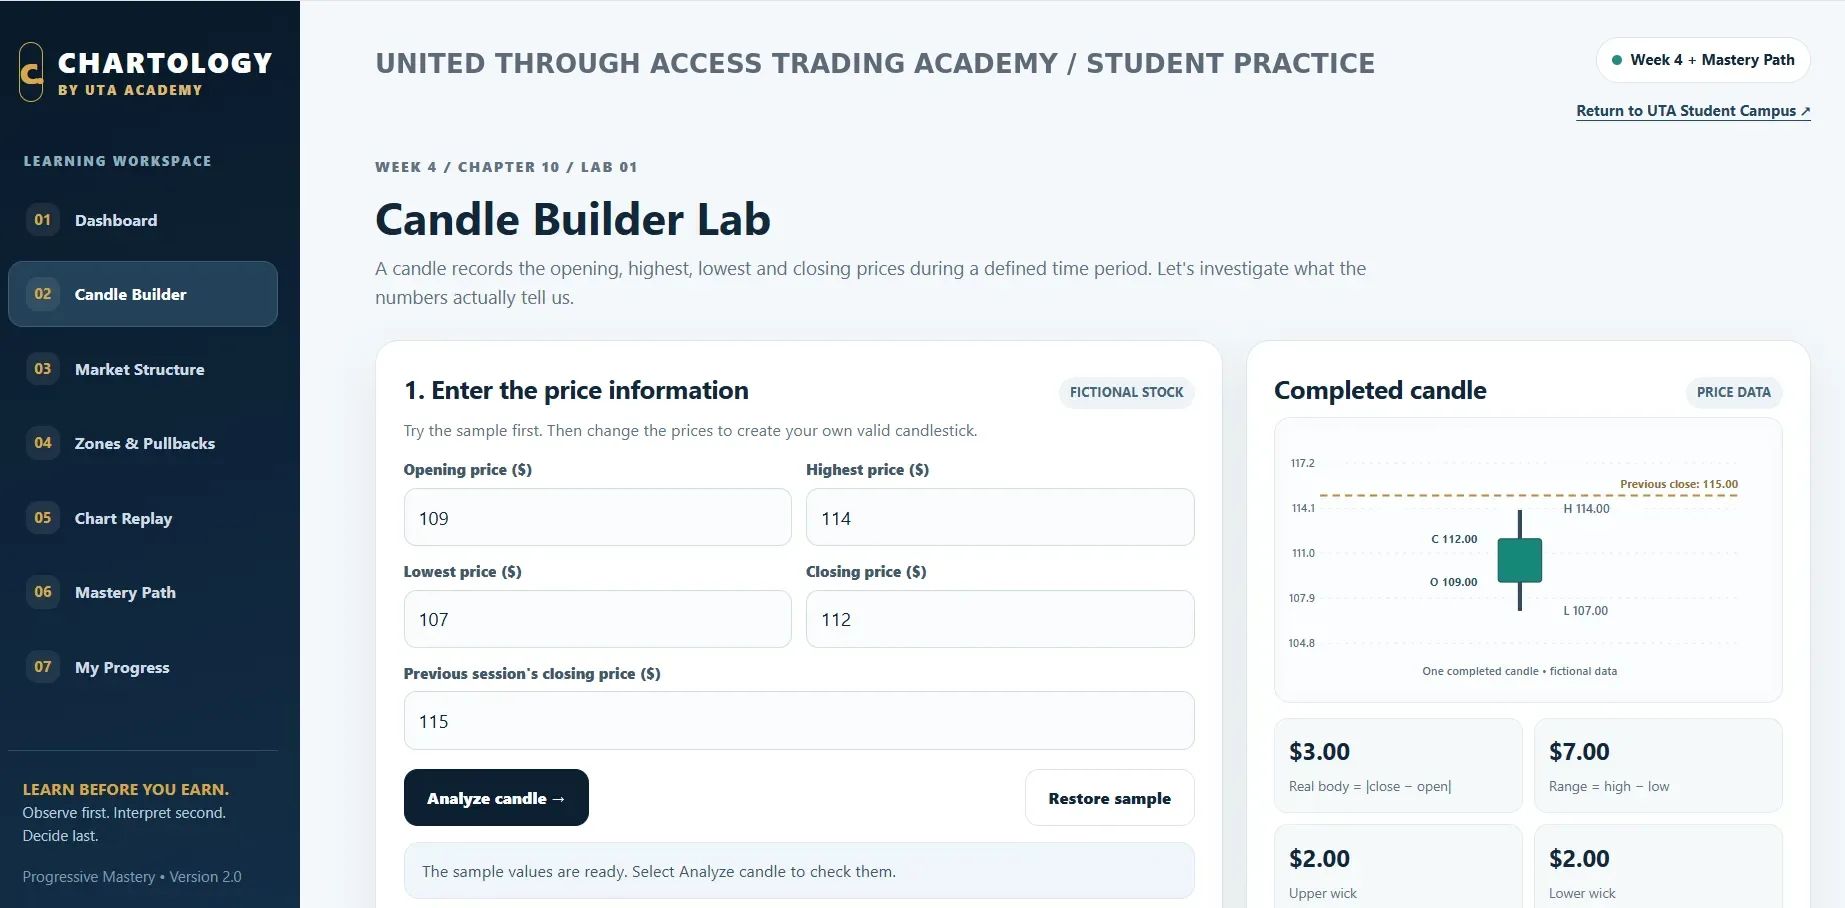
Build a clearer understanding of candles, price behavior, market structure, trends, and important levels.
Connect support and resistance, pullbacks, and potential reversals to chart context and a reasoned explanation.
Revisit price action and use interactive challenges to strengthen observation and review habits.
Part of a broader education
Chartology complements UTA’s structured market education. It supports learning, not trading signals or promises of performance.